Our analyses suggest that biodiversity has
continued to decline over the past four decades,
with most (8 out of 10) state indicators showing
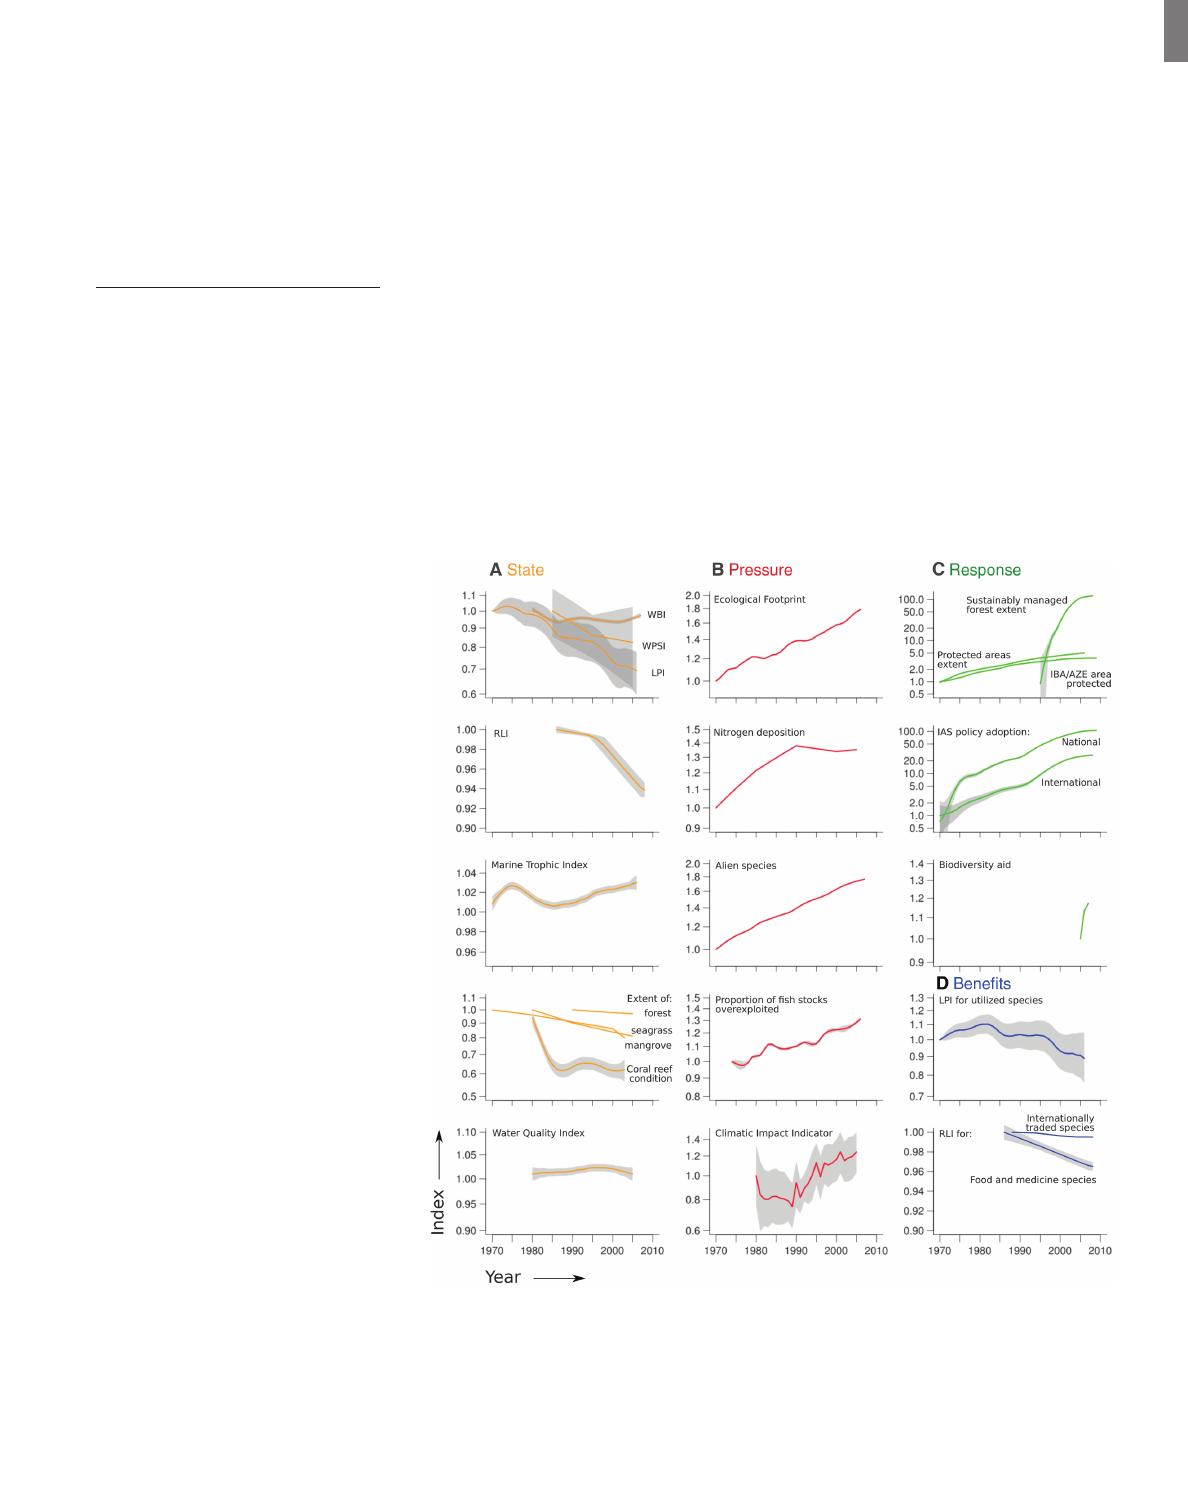
negative trends (Fig. 1 and Table 1). There have
been declines in population trends of (i) ver-
tebrates (13) and (ii) habitat specialist birds; (iii)
shorebird populations worldwide; extent of (iv)
forest (14, 15); (v) mangroves; (vi) seagrass beds;
and (vii) the condition of coral reefs. None show
significant recent reductions in the rate of decline
(Table 1), which is either fluctuating (i), stable (ii),
based on too few data to test significance (iii to vi),
or stable after a deceleration two decades ago (vii).
Two indicators, freshwater quality and trophic in-
tegrity in the marine ecosystem, show stable and
marginally improving trends, respectively, which
are likely explained by geographic biases in data
availability for the former and spatial expansion
of fisheries for the latter (5). Aggregated trends
across state indicators have declined, with no sig-
nificant recent reduction in rate: The most recent
inflection in the index (in 1972) was negative (Fig.
2). Because there were fewer indicators with trend
data in the 1970s, we recalculated the index from
1980, which also showed accelerating biodiversity
loss: The most recent inflection (2004) was neg-
ative. Finally, aggregated species’ extinction risk
(i.e., biodiversity loss at the species level) has ac-
celerated: The International Union for Conservation
of Nature ( IUCN) Red List Index (RLI), measuring
rate of change (16, 17), shows negative trends.
The majority of indicators of pressures on
biodiversity show increasing trends over recent
decades (Fig. 1 and Table 1), with increases in (i)
aggregate human consumption of the planet’s
ecological assets, (ii) deposition of reactive nitro-
gen, (iii) number of alien species in Europe, (iv)
proportion of fish stocks overharvested, and (v)
impact of climate change on European bird pop-
ulation trends (18). In no case was there a signif-
icant reduction in the rate of increase (Table 1),
which was stable (i, iii, and v), fluctuating (iv), or
based on too few data to test significance (ii),
although g rowth in global nitrogen deposition may
have slowed, and this may explain why the most
recent inflection in aggregated trends (in 2006)
was negative (Fig. 2) (5). Global trends for
habitat fragmentation are unavailable, but it is
probably increasing; for example, 80% of remain-
ing Atlantic Forest fragments are <0.5 km
2
in
size (19), and 59% of larg e river systems are
moderately or strongly fragmented by dams and
reservoirs (20).
1
United Nations Environment Programme W orld Conservation
Monitoring Centre, 219 Huntingdon Road, Cambridge CB3
0DL, UK.
2
BirdLife International, Wellbrook Court, Cambridge
CB3 0NA, UK.
3
Institute of Zoology, Zoological Society of
London, Regent’sPark,LondonNW14RY,UK.
4
Statistics
Netherlands, Post Office Box 24500, The Hague, 2490 HA,
Netherlands.
5
Department of Marine Sciences, University of
North Carolina at Chapel Hill, 340 Chapman Hall, CB 3300,
Chapel Hill, NC 27599, USA.
6
International Union for
Conservation of Nature (IUCN) and Conservation International
Global Marine Species Assessment, Biological Sciences, Old
DominionUniversity,Norfolk,VA23529,USA.
7
United
Nations Environment Programme, Global Environment Mon-
itoring System —Water, c/o National Water Research Institute,
867 Lakeshore Road, Burlington, Ontario L7R 4A6, Canada.
8
IUCN Species Survival Commission, Conservation Interna-
tional, Biodiversity Assessment Unit, c/o Center for Applied
Biodiversity Science, Conservation International, 2011 Crystal
Drive, Suite 500, Arlington, VA 22202, USA.
9
Fisheries and
Aquaculture Management Division, Food and Agriculture
Organization of the United Nations, Viale delle Terme di
Caracalla 00153, Rome, Italy.
10
SecretariatoftheRamsar
Convention on Wetlands, Rue Mauverney 28, 1196 Gland,
Switzerland.
11
European Commission Joint Research Centre,
Institute for Environment and Sustainability, TP290, Via
Enrico Fermi 2749, 21027 Ispra (VA), Italy.
12
Center for
Applied Biodiversity Science, Conservation International,
2011 Crystal Drive, Suite 500, Arlington, VA 22202, USA.
13
Global Footprint Network, 312 Clay Street, Suite 300,
Oakland, CA 94607–3510, USA.
14
Environmental Sciences
Department, University of Virginia, Ch arlot tesv ille, VA
22903, U SA.
15
Istituto Superiore per la Protezione e la
Ricerca Ambientale, Via Curtatone 3, I-00185 Rome, Italy.
16
Royal Society for the Protection of Birds, The Lodge, Sandy
SG19 2DL, UK, and European Bird Census Council.
17
School of I ntegrative Systems, University of Queensland,
St. Lucia, Brisbane, Qld 4067, Australia.
18
Department of
Zoology, University of Cambridge, Downing Street, Cam-
bridge CB2 3EJ, UK.
19
National Center for Atmospheric
Research, 3450 Mitchell Lane, Boulder, CO 80301, USA.
20
World Wildlife Fund (WWF) Internat ional, 1196 Gland,
Switzerland.
21
South African National Parks, Centre for
Invasion Biology and Global Invasive Species Programme,
Post Office Box 216, Steenberg 7947, South Africa.
22
United
Nations Educational, Scientific, and Cultural Organization,
7 place de Fontenoy, 75352 Paris, France.
23
TRAFFIC
International, 219 Huntingdon Road, Cambridge CB3 0DL,
UK.
24
Sea Around Us Project, Fisheries Centre, University of
British Columbia, 2202 Main Mall, Vancouver, BC V6T1Z4,
Canada.
25
National Centre for Biological Sciences, Tata
Institute of Fundamental Research, GKVK Campus, Bellary
Road, Bangalore 560 065, India.
26
The Nature Conservancy,
4245 North Fairfax Drive, Arlington, VA 22203, USA.
27
U.S.
Geological Survey, Patuxent Wildlife Research Center, 12100
Beech Forest Road, Laurel, MD 20708–4039, USA.
28
Amer-
ican Bird Conservancy, 1731 Connecticut Avenue, N.W., 3rd
Floor, Washington, DC 20009, USA.
29
Centre for Invasion
Biology, Stellenbosch University, Private Bag X1, Matieland
7602, South Africa.
30
IUCN Species Survival Commission,
Department of Biology and Biochemistry, University of Bath,
Bath BA2 7AY, UK.
31
Al Ain Wildlife Park and Resort, Post
Office Box 45553, Abu Dhabi, United Arab Emirates.
32
IUCN,
Rue Mauverney 28, 1196 Gland, Switzerland.
*To whom correspondence should be addressed. E-mail:
†Present address: Indian and Northern Affairs Canada, 15
Eddy, Gatineau QC K1A 0H4, Canada.
Fig. 1. Indicator trends for (A)thestateofbiodiversity,(B) pressures upon it, (C) responses to address its
loss, and (D) the benefits humans derive from it. Data scaled to 1 in 1970 (or for first year of data if
>1970), modeled (if >13 data points; see Table 1), and plotted on a logarithmic ordinate axis. Shading
shows 95% confidence intervals except where unavailable (i.e., mangrove, seagrass, and forest extent,
nitrogen deposition, and biodiversi tyaid).WBI,WildBirdIndex;WPSI,Waterbird Population Status Index;
LPI, Living Planet Index; RLI, Red List Index; IBA, Important Bird Area; AZE, Alliance for Zero Extinction
site; IAS, invasive alien species.
www.sciencemag.org SCIENCE VOL 328 28 MAY 2010
1165
REPORTS