

Technical analysis is a method used to evaluate and forecast price movements in financial markets by analyzing historical data. This module covers essential tools such as charts, trend lines, support and resistance levels, and various technical indicators. It is designed for traders and investors looking to enhance their market analysis skills. Key concepts include candlestick patterns, volume analysis, and Fibonacci retracements. Understanding these tools can significantly improve decision-making in trading strategies.

Key Points

  • Explains key tools of technical analysis including charts and indicators
  • Covers support and resistance levels essential for trading decisions
  • Discusses candlestick patterns and their significance in market trends
  • Includes practical tips for managing risks and following market trends

Arth gupta
27 pages
Language:English
Type:Study Guide
Arth gupta
27 pages
Language:English
Type:Study Guide
423
/ 27
MODULE 3 TECHNICAL ANALYSIS
Technical Analysis:
Technical analysis is a method used in finance and investing to evaluate and forecast the
future direction of prices in financial markets by analyzing historical price and trading
volume data. It is based on the idea that historical price movements and patterns tend to
repeat, providing insights into potential future price movements. Technical analysis is
commonly used in various financial markets, including stocks, commodities, currencies,
and cryptocurrencies.
Key Tools of Technical Analysis:
1) Charts:
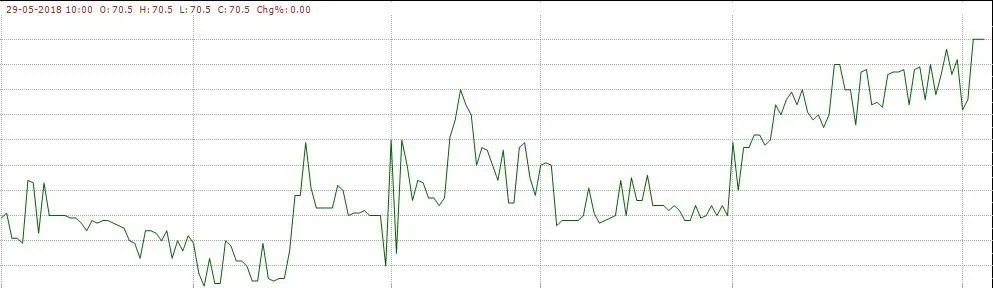
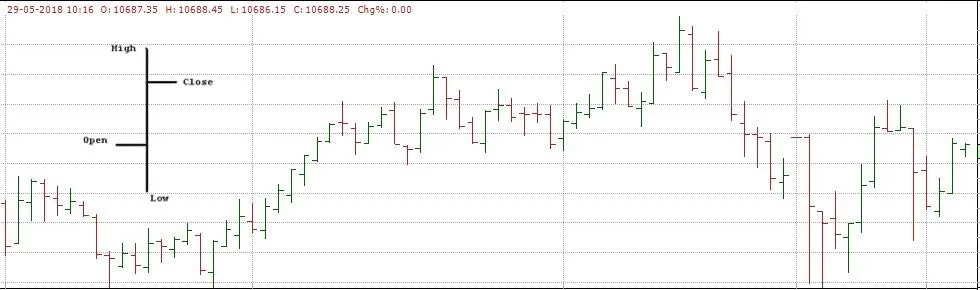
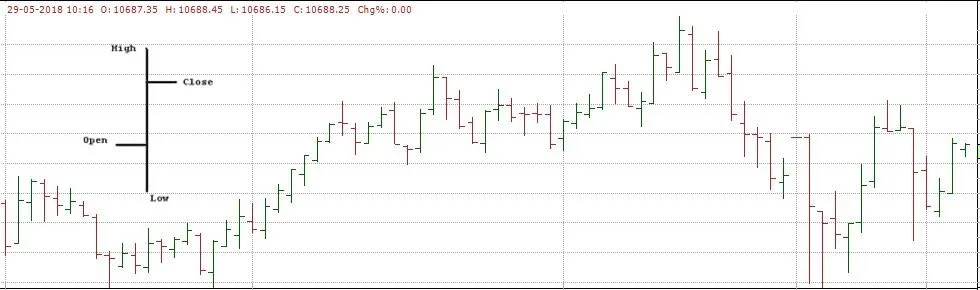
Types: Various types of charts are used, including line charts, bar charts, and candlestick
charts.
Time Frames: Charts can be analyzed over different time frames, such as daily, weekly, or
monthly, to identify short-term and long-term trends.
2) Trend Lines:
Definition: Trend lines are drawn on charts to represent the direction and strength of a
trend.
Identification: Upward-sloping lines indicate an uptrend, while downward-sloping lines
suggest a downtrend.
3) Support and Resistance Levels:
Support: Price levels where a security often stops falling.
Resistance: Price levels where a security often stops rising.
Analysis: Identifying these levels helps traders make decisions about buying or selling.
4) Technical Indicators:
Examples: Moving averages, Relative Strength Index (RSI), Moving Average
Convergence Divergence (MACD), and stochastic oscillators.
Purpose: Indicators help identify trends, momentum, volatility, and overbought or
oversold conditions.
5) Candlestick Patterns:
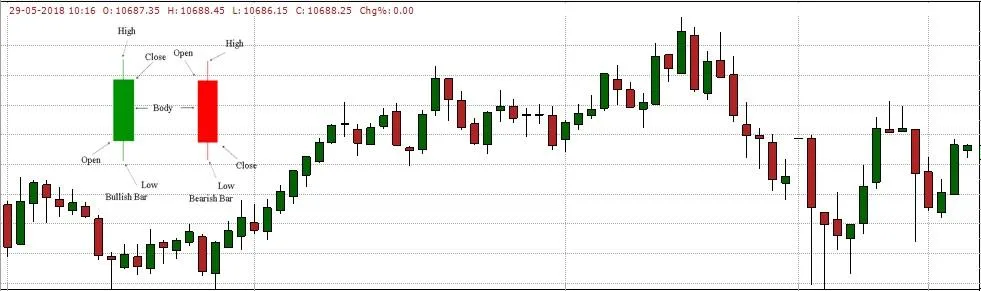
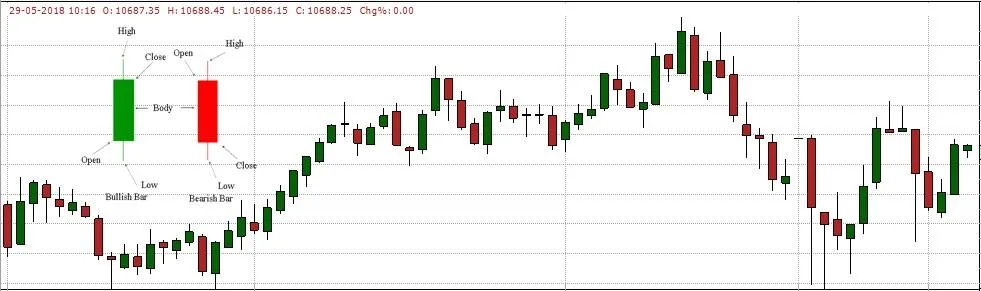
Definition: Candlestick charts display price movements using candle-shaped symbols.
Patterns: Specific candlestick patterns, such as doji, hammer, and engulfing patterns, are
used to predict market reversals or continuations.
6) Volume Analysis:
Importance: Trading volume reflects the number of shares or contracts traded.
Interpretation: Volume analysis helps confirm the strength of a price movement; rising
prices with high volume are considered more significant.
7) Chart Patterns:
Examples: Head and shoulders, double tops and bottoms, triangles, and flags.
Interpretation: Chart patterns are formations that indicate potential future price
movements.
8) Fibonacci Retracements:
Concept: Based on the Fibonacci sequence, retracement levels (38.2%, 50%, and 61.8%)
are used to identify potential reversal levels in a trend.
9) Elliott Wave Theory:
Theory: Proposes that financial markets move in repetitive cycles or waves.
Analysis: Traders use wave patterns to predict future price movements.
Technical analysts often use a combination of these tools to make informed trading
decisions. It's important to note that while technical analysis is widely used, it has its critics,
and traders often combine it with fundamental analysis for a more comprehensive view of
the market.
Note on Trading rules
Follow the Trend
Tip: Go with the flow. If prices are going up, consider buying. If they're going down, think
about selling.
Why: Trends often continue in the same direction.
Manage Risks
Tip: Don't put all your eggs in one basket. Set limits on how much you're willing to lose.
Why: Protecting your money is key for long-term success.
Spot Support and Resistance
Tip: Look for levels where prices often stop or turn. These are like traffic signals for traders.
Why: These levels can signal potential changes in direction.
Use Different Indicators
Tip: Don't rely on just one tool. Combine different indicators for a clearer picture.
Why: More perspectives can lead to better decisions.
Trade with Volume
Tip: Check if a price move is backed by trading activity. More activity can confirm a real
move.
Why: Volume shows the strength of a price change.
Stay Cool, Avoid Drama
Tip: Stick to your plan, don't let emotions take over.
Why: Emotional decisions often lead to mistakes.
Stay Updated on News
/ 27
End of Document
423

FAQs

what is technical analysis module 3 key concepts and tools

Technical Analysis Module 3 covers essential concepts and tools used in financial markets to evaluate price movements and trends.

  • Charts: Various types including line, bar, and candlestick charts.
  • Indicators: Tools like Moving Averages and RSI that help identify trends and market conditions.
  • Support and Resistance: Key levels where prices tend to stop or reverse.
  • Candlestick Patterns: Specific formations that indicate potential market reversals.
  • Volume Analysis: Understanding trading volume to confirm price movements.

how to use technical analysis module 3 tools effectively

Using the tools from Technical Analysis Module 3 effectively involves understanding their applications in trading.

  • Charts: Analyze price movements over different time frames to identify trends.
  • Indicators: Use multiple indicators together for a clearer market picture.
  • Volume Analysis: Confirm price changes with trading volume to assess strength.
  • Support and Resistance Levels: Identify these levels to make informed buying or selling decisions.

what are the key indicators in technical analysis module 3

Key indicators in Technical Analysis Module 3 include various tools that help traders assess market conditions.

  • Moving Averages: Used to smooth price data and identify trends.
  • Relative Strength Index (RSI): Measures momentum and identifies overbought or oversold conditions.
  • Moving Average Convergence Divergence (MACD): Helps determine the strength and direction of a trend.
  • Fibonacci Retracements: Used to identify potential reversal levels based on the Fibonacci sequence.

what is the importance of support and resistance in technical analysis module 3

Support and resistance levels are crucial concepts in Technical Analysis Module 3 that help traders make informed decisions.

  • Support Level: A price level where a security tends to stop falling, indicating buying interest.
  • Resistance Level: A price level where a security tends to stop rising, indicating selling pressure.
  • Trading Decisions: Identifying these levels can help traders decide when to enter or exit trades.
  • Market Sentiment: These levels reflect overall market sentiment and can indicate potential trend reversals.

how do candlestick patterns work in technical analysis module 3

Candlestick patterns are a key component of Technical Analysis Module 3, used to predict market movements.

  • Structure: Each candlestick represents price movement over a specific time frame, showing open, high, low, and close prices.
  • Reversal Patterns: Patterns like doji, hammer, and engulfing indicate potential reversals in market trends.
  • Trend Continuation: Some patterns suggest that the current trend will continue, helping traders make decisions.
  • Short-Term Analysis: Candlestick patterns are particularly useful for short-term trading strategies.

what is volume analysis in technical analysis module 3

Volume analysis is an important aspect of Technical Analysis Module 3 that helps confirm price movements.

  • Definition: Volume reflects the number of shares or contracts traded during a specific period.
  • Strength of Price Movement: Rising prices accompanied by high volume indicate a strong trend, while low volume may suggest weakness.
  • Market Sentiment: Analyzing volume can provide insights into market sentiment and potential reversals.
  • Confirmation of Patterns: Volume can confirm candlestick patterns and other technical indicators.

what are the main chart types in technical analysis module 3

The main chart types discussed in Technical Analysis Module 3 include several formats used for price analysis.

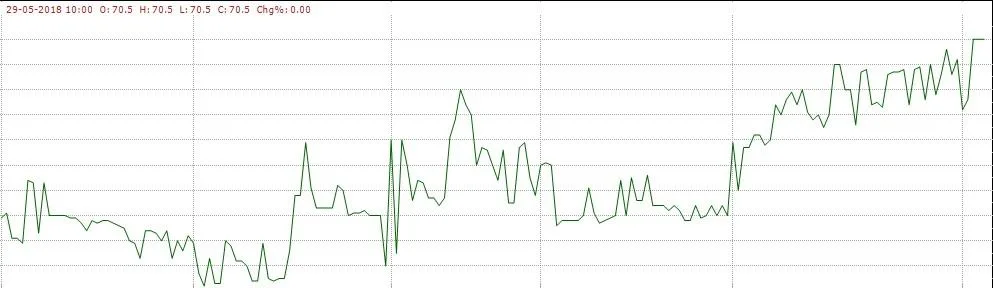
  • Line Charts: Show closing prices over time, providing a simple view of price trends.
  • Bar Charts: Display open, high, low, and close prices, giving more detailed information than line charts.
  • Candlestick Charts: Provide visual representations of price movements with patterns indicating potential market reversals.
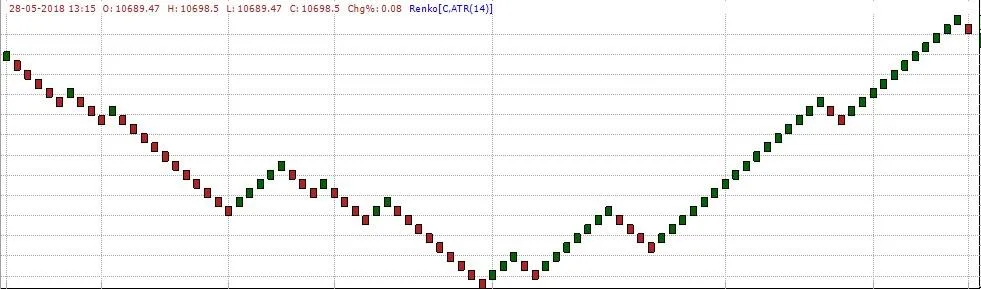
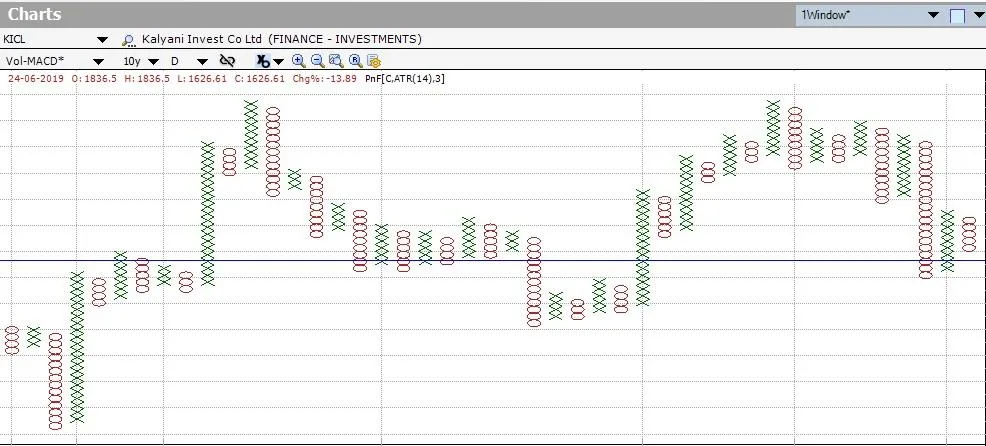
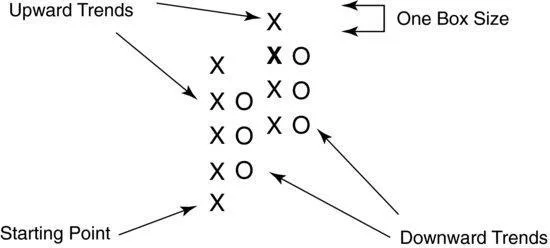
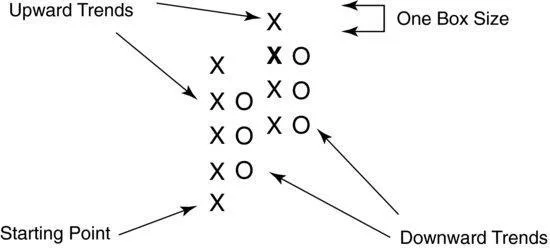
  • Renko and Point-and-Figure Charts: Focus on price movements while filtering out time, useful for identifying trends and support/resistance levels.

what is the role of trend lines in technical analysis module 3

Trend lines play a significant role in Technical Analysis Module 3 by helping traders visualize market direction.

  • Definition: Trend lines are straight lines drawn on charts to indicate the direction of price movements.
  • Upward Trend Lines: Indicate rising prices, suggesting a bullish market.
  • Downward Trend Lines: Indicate falling prices, suggesting a bearish market.
  • Support and Resistance: Trend lines can also act as dynamic support and resistance levels, guiding trading decisions.

how does the fibonacci retracement work in technical analysis module 3

Fibonacci retracement is a technique in Technical Analysis Module 3 used to identify potential reversal levels in trends.

  • Concept: Based on the Fibonacci sequence, key retracement levels are 38.2%, 50%, and 61.8%.
  • Application: Traders use these levels to predict where prices may reverse after a pullback in a trend.
  • Market Psychology: These levels often align with market psychology, making them significant for traders.
  • Combining with Other Tools: Fibonacci retracement can be used alongside other technical indicators for better accuracy.