Essential Graphs for Microeconomics – Key Economic Concepts
Essential Graphs for Microeconomics provides a comprehensive overview of key economic concepts, including the Production Possibilities Curve, consumer and producer surplus, and the effects of taxes. This resource is designed for students studying microeconomics, offering visual aids and explanations that clarify complex topics. It covers various market structures, including perfectly competitive and monopolistic markets, and discusses the implications of market failures and externalities. Ideal for learners preparing for exams or seeking to deepen their understanding of microeconomic principles.
Key Points
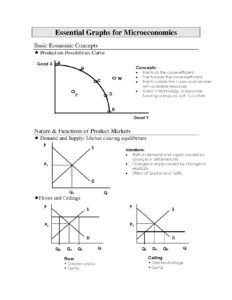
Explains the Production Possibilities Curve and its implications for efficiency.
Covers consumer and producer surplus with graphical representations.
Discusses the effects of taxes on demand and supply curves.
Analyzes different market structures including perfect competition and monopoly.
This link leads to an external site. We do not know or endorse its content, and are not responsible for its safety. Click the link to proceed only if you trust this site.
AP Physics 1 Unit 3 MCQ Scoring Guide – Concepts of Energy and MotionStudy Guide
PDFStudy Guide
Linked List Concepts and Implementation TechniquesStudy Guide
PDFStudy Guide
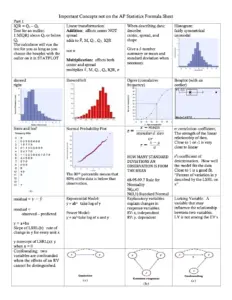
Important Concepts not on the AP Statistics Formula SheetStudy Guide
PDFStudy Guide
AP Calculus AB Unit 1 Progress Check MCQ Part B – Key Concepts AssessmentStudy Guide
PDFStudy Guide
Community Health: Frameworks and ConceptsStudy Guide
PDF
Microeconomics Unit 3 Demand and Supply Notes 2025 (2)
PDF
Microeconomics Unit 6 Perfect Competition Notes
PDF
Utility and Elasticity Concepts for Economics Revision
PDF
Microeconomics Unit 3 Demand and Supply Notes 2025
PDF
2018 AP Microeconomics Practice Exam Unlocked
FAQs
What is the significance of the Production Possibilities Curve?
The Production Possibilities Curve (PPC) illustrates the trade-offs between two goods, showing the maximum possible output combinations with available resources. Points on the curve represent efficient production, while points inside indicate inefficiency, and points outside are unattainable. The curve can shift due to technological advancements or resource changes, affecting the production capacity of one or both goods.
How do taxes affect consumer and producer surplus?
Taxes impact consumer and producer surplus by shifting the demand or supply curve. When a tax is imposed on buyers, the demand curve shifts left, reducing consumer surplus. Conversely, a tax on sellers shifts the supply curve left, decreasing producer surplus. The shaded area in the graphs represents the amount of tax, and connecting the dots helps identify the deadweight loss, indicating efficiency loss in the market.
What defines allocative efficiency in microeconomics?
Allocative efficiency occurs when the marginal cost (MC) of producing a good equals its marginal benefit (MB). This means resources are allocated optimally, with no underallocation or overallocation. The document emphasizes that achieving this balance ensures that the output of a good is expanded until MC and MB are equal, maximizing societal welfare.
What are the characteristics of a perfectly competitive market structure?
In a perfectly competitive market, firms are price takers, meaning they cannot influence the market price. The long-run equilibrium occurs where price equals marginal revenue (MR) and marginal cost (MC), resulting in allocative and productive efficiency at the minimum average total cost (ATC). Variations in the market can lead to short-run profits or losses, influencing firm behavior and market dynamics.
How does the Law of Diminishing Marginal Utility affect consumer behavior?
The Law of Diminishing Marginal Utility states that as a consumer increases the consumption of a good, the additional satisfaction (utility) gained from each subsequent unit decreases. This principle explains why demand curves slope downward; consumers are willing to pay less for additional units as their satisfaction diminishes. Total utility increases at a diminishing rate, reaching a maximum before declining.
What is the relationship between Marginal Revenue and Marginal Cost?
Marginal Revenue (MR) is the change in total revenue from selling one additional unit, while Marginal Cost (MC) is the change in total costs from producing one more unit. Competitive firms determine their profit-maximizing output by setting MR equal to MC. This intersection point indicates the optimal level of production where firms maximize their profits or minimize losses.
What are the effects of externalities on market efficiency?
Externalities occur when the costs or benefits of a good affect third parties not directly involved in the transaction. Negative externalities, like pollution, lead to overallocation of resources, as the true costs are not reflected in the market price. Conversely, positive externalities, such as education, result in underallocation, where societal benefits exceed private benefits. Addressing these externalities often requires government intervention.
Related
PDF
Ap Microeconomics Course And Exam Description
PDF
AP Microeconomics Practice Exam
PDFStudy Guide
Biostatistics Record: Comprehensive Guide for MBBS 2024Study Guide
PDFStudy Guide
Spotlight 1, 2 & 3 Download LinksStudy Guide
PDFStudy Guide
Reshaping India’s Political MapStudy Guide
PDFStudy Guide
Informed Testing: Practices for Effective EFL Teaching and LearningStudy Guide
PDFStudy Guide
English Speaking and Writing Guide for Reviews, Interviews, and LettersStudy Guide
PDFStudy Guide
Determinants DIBY MathsStudy Guide
PDFStudy Guide
KPP 03 ElectrostaticsStudy Guide
PDFStudy Guide
Tarentaal: Poem Analysis and Study GuideStudy Guide
PDFStudy Guide
OPP Question Bank: Comprehensive Guide for Printing TechniquesStudy Guide
PDFStudy Guide
Artificial Intelligence and Machine Learning Practical GuideStudy Guide