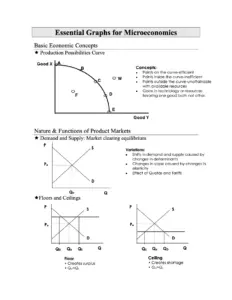
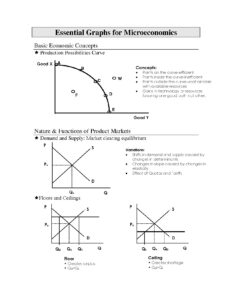
Essential Graphs for Microeconomics provides a comprehensive overview of key economic concepts through visual representations. It covers critical topics such as the Production Possibilities Curve, demand and supply dynamics, consumer and producer surplus, and the effects of taxes. This resource is ideal for students studying microeconomics, particularly those preparing for exams or seeking to understand market structures and efficiencies. The document includes various graphs illustrating concepts like allocative and productive efficiency, long-run costs, and the law of diminishing returns, making it a valuable tool for visual learners. Perfect for AP Microeconomics students and anyone interested in economic theory.
Key Points
Illustrates the Production Possibilities Curve and its implications for efficiency.
Explains consumer and producer surplus with graphical representations.
Covers the effects of taxes on demand and supply curves.
Details long-run costs in perfectly competitive and monopolistic markets.
This link leads to an external site. We do not know or endorse its content, and are not responsible for its safety. Click the link to proceed only if you trust this site.
Essential Graphs for Microeconomics – Key Economic ConceptsStudy Guide
PDF
Essential Graphs for Microeconomics Study Guide
PDFNotes
C++ Programming Essentials: Key Concepts and TechniquesNotes
PDFSheet Music
Essential Elements 2000: Comprehensive Band Method for Electric BassSheet Music
PDFTextbook
Essential Tools of GeographyTextbook
PDFGuide
DND New DM Reading List – Essential Player’s Handbook SectionsGuide
PDFGuide
Essential Business Plan Points for EntrepreneursGuide
PDF
Microeconomics Unit 3 Demand and Supply Notes 2025 (2)
PDF
Microeconomics Unit 6 Perfect Competition Notes
PDF
Microeconomics Unit 3 Demand and Supply Notes 2025
PDF
Plotting Scatter Graphs Mathematics Lesson 11.1
PDF
Drawing Linear Graphs for Mathematics Students
FAQs
What is the Production Possibilities Curve and its significance?
The Production Possibilities Curve (PPC) illustrates the maximum feasible output combinations of two goods given available resources and technology. Points on the curve represent efficient production levels, while points inside indicate inefficiency, and points outside are unattainable. The PPC helps demonstrate concepts like opportunity cost and trade-offs, making it essential for understanding resource allocation in microeconomics.
How do taxes affect consumer and producer surplus?
Taxes imposed on buyers shift the demand curve leftward, reducing consumer surplus as buyers pay higher prices. Conversely, taxes on sellers shift the supply curve leftward, decreasing producer surplus as sellers receive lower prices. The area between the demand and supply curves represents the tax burden, leading to a deadweight loss in market efficiency. Understanding these effects is crucial for analyzing market interventions.
What are the characteristics of perfectly competitive markets?
Perfectly competitive markets are characterized by many buyers and sellers, homogeneous products, and free entry and exit. In such markets, firms are price takers, meaning they accept the market price as given. Long-run equilibrium occurs when firms earn normal profits, with price equating to marginal cost and average total cost at its minimum. This leads to allocative and productive efficiency, where resources are optimally allocated.
What is the law of diminishing returns?
The law of diminishing returns states that as additional units of a variable resource are added to a fixed resource, the marginal product will eventually decline. Initially, adding more workers may increase output significantly, but over time, the additional output gained from each new worker decreases. This concept is crucial for understanding production efficiency and cost management in microeconomics.
How do externalities affect market efficiency?
Externalities occur when the actions of individuals or firms have unintended effects on third parties, leading to market inefficiencies. Negative externalities, like pollution, result in overallocation of resources, while positive externalities, such as education, lead to underallocation. These discrepancies highlight the need for government intervention to correct market failures and achieve a socially optimal level of production.