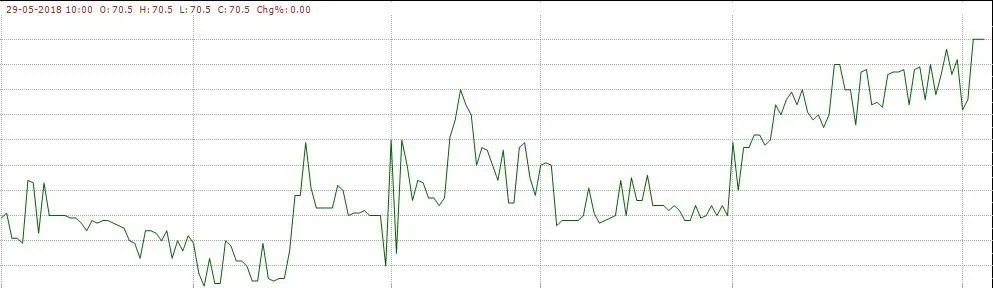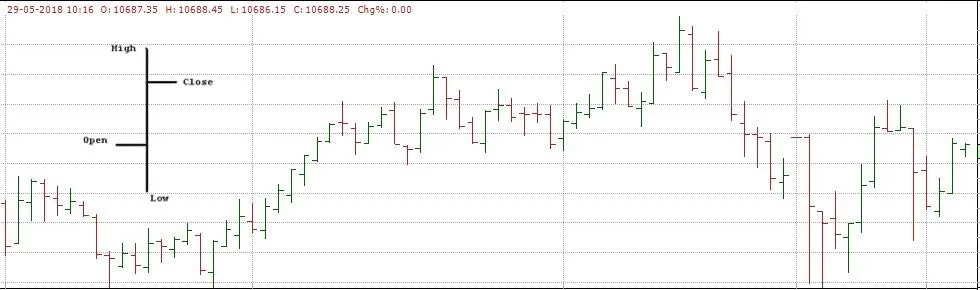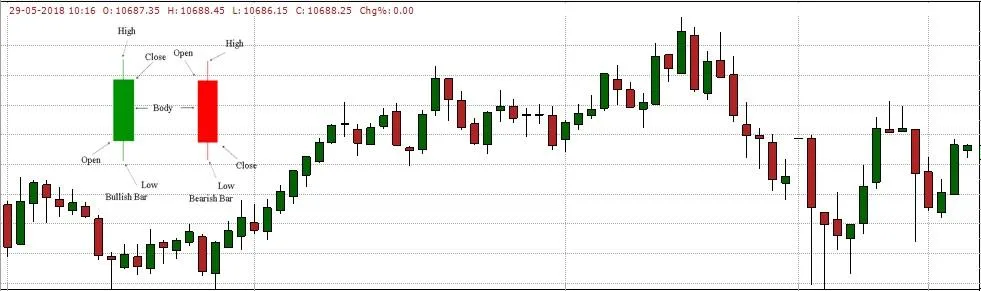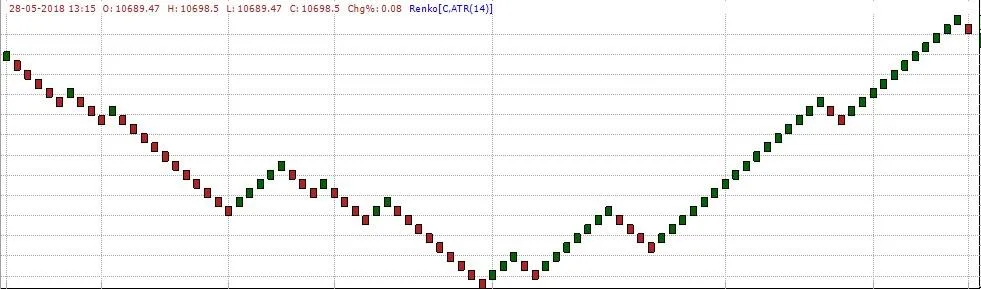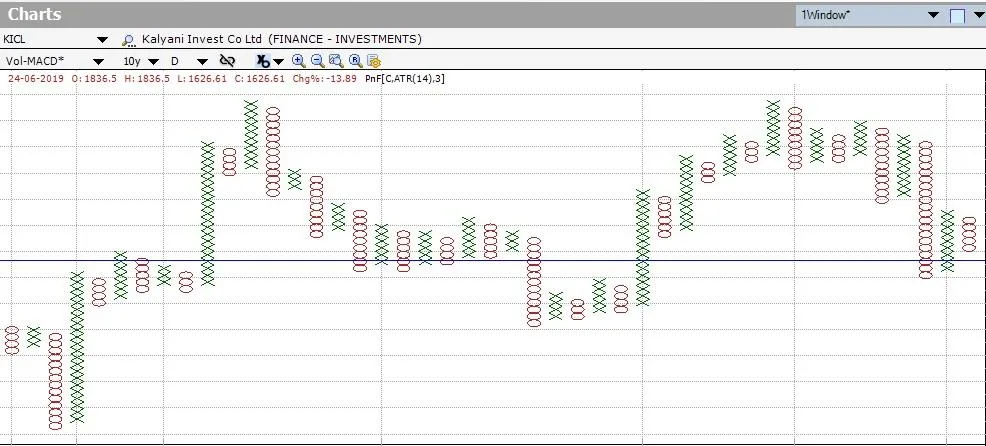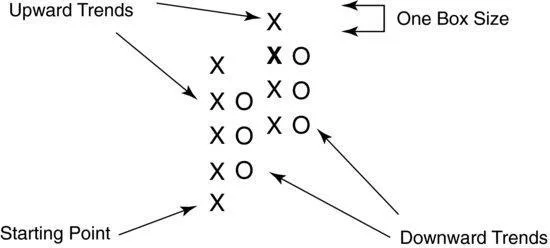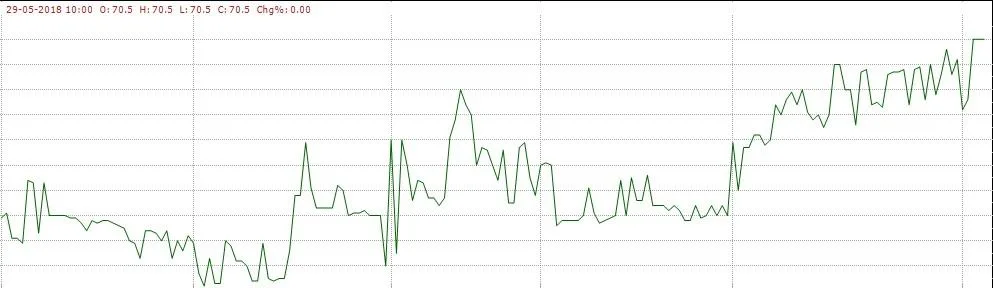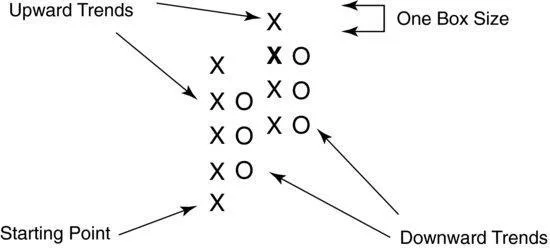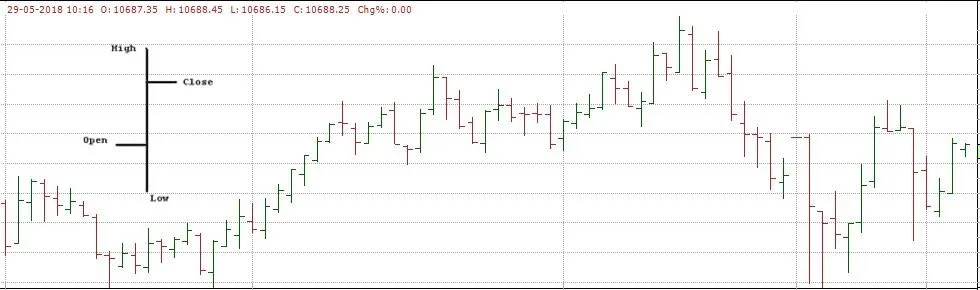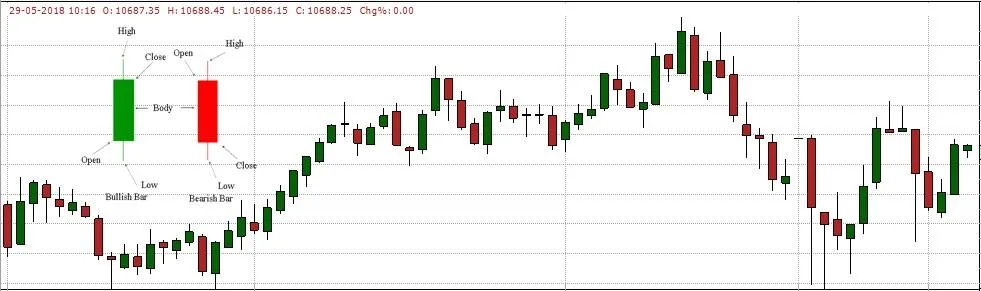


Technical analysis is a method used to evaluate and forecast price movements in financial markets by analyzing historical data. This module covers essential tools such as charts, trend lines, support and resistance levels, and various technical indicators. It is designed for traders and investors looking to enhance their market analysis skills. Key concepts include candlestick patterns, volume analysis, and Fibonacci retracements. Understanding these tools can significantly improve decision-making in trading strategies.
Key Points
- Explains key tools of technical analysis including charts and indicators
- Covers support and resistance levels essential for trading decisions
- Discusses candlestick patterns and their significance in market trends
- Includes practical tips for managing risks and following market trends