Essential AP Statistics concepts that are not included on the official formula sheet are outlined in this guide. It covers key topics such as sampling methods, experimental design, probability, and hypothesis testing. Students preparing for the AP Statistics exam will find valuable insights into statistical concepts, including linear transformations and the Central Limit Theorem. The guide also explains the importance of understanding bias, control groups, and the significance of p-values in hypothesis testing. This resource is ideal for high school students aiming to excel in AP Statistics.

Key Points

  • Explains key statistical concepts not included in the AP Statistics formula sheet.
  • Covers sampling methods such as simple random sampling and stratified sampling.
  • Details experimental design principles, including control groups and randomization.
  • Discusses probability concepts, including binomial and geometric distributions.
  • Highlights the importance of hypothesis testing and interpreting p-values.
newtopiccyclegrowin
14 pages
Language:English
Type:Study Guide
newtopiccyclegrowin
14 pages
Language:English
Type:Study Guide
317
/ 14
Important Concepts not on the AP Statistics Formula Sheet
Part I:
IQR = Q
3
Q
1
Test for an outlier:
1.5(IQR) above Q
3
or below
Q
1
The calculator will run the
test for you as long as you
choose the boxplot with the
oulier on it in STATPLOT
Linear transformation:
Addition: affects center NOT
spread
adds to , M, Q
1
, Q
3,
IQR
not σ
Multiplication: affects both
center and spread
multiplies , M, Q
1
, Q
3,
IQR, σ
When describing data:
describe
center, spread, and
shape.
Give a 5 number
summary or mean and
standard deviation when
necessary.
Histogram:
fairly symmetrical
unimodal
skewed
right
Skewed left
Ogive (cumulative
frequency)
Boxplot (with an
outlier)
Stem and leaf
Normal Probability Plot
The 80
th
percentile means that
80% of the data is below that
observation.
HOW MANY STANDARD
DEVIATIONS AN
OBSERVATION IS FROM
THE MEAN
68-95-99.7 Rule for
Normality
N(µ,σ)
N(0,1) Standard Normal
r: correlation coefficient,
The strength of the linear
relationship of data.
Close to 1 or -1 is very
close to linear
r
2
: coefficient of
determination. How well
the model fits the data.
Close to 1 is a good fit.
“Percent of variation in y
described by the LSRL on
x”
residual =
residual =
observed predicted
y = a+bx
Slope of LSRL(b): rate of
change in y for every unit x
y-intercept of LSRL(a): y
when x = 0
Exponential Model:
y = ab
x
take log of y
Power Model:
y = ax
b
take log of x and y
Explanatory variables
explain changes in
response variables.
EV: x, independent
RV: y, dependent
Lurking Variable: A
variable that may
influence the relationship
bewteen two variables.
LV is not among the EV’s
Confounding: two
variables are confounded
when the effects of an RV
cannot be distinguished.
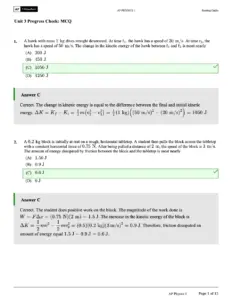
Part II: Designing Experiments and Collecting Data:
Sampling Methods:
The Bad:
Voluntary sample. A voluntary sample is made up of people who decide for themselves to be in the survey.
Example: Online poll
Convenience sample. A convenience sample is made up of people who are easy to reach.
Example: interview people at the mall, or in the cafeteria because it is an easy place to reach people.
The Good:
Simple random sampling. Simple random sampling refers to a method in which all possible samples of n objects are equally
likely to occur.
Example: assign a number 1-100 to all members of a population of size 100. One number is selected at a time from a list of
random digits or using a random number generator. The first 10 selected are the sample.
Stratified sampling. With stratified sampling, the population is divided into groups, based on some characteristic. Then, within
each group, a SRS is taken. In stratified sampling, the groups are called strata.
Example: For a national survey we divide the population into groups or strata, based on geography - north, east, south, and
west. Then, within each stratum, we might randomly select survey respondents.
Cluster sampling. With cluster sampling, every member of the population is assigned to one, and only one, group. Each group
is called a cluster. A sample of clusters is chosen using a SRS. Only individuals within sampled clusters are surveyed.
Example: Randomly choose high schools in the country and only survey people in those schools.
Difference between cluster sampling and stratified sampling. With stratified sampling, the sample includes subjects from each
stratum. With cluster sampling the sample includes subjects only from sampled clusters.
Multistage sampling. With multistage sampling, we select a sample by using combinations of different sampling methods.
Example: Stage 1, use cluster sampling to choose clusters from a population. Then, in Stage 2, we use simple random sampling
to select a subset of subjects from each chosen cluster for the final sample.
Systematic random sampling. With systematic random sampling, we create a list of every member of the population. From the
list, we randomly select the first sample element from the first k subjects on the population list. Thereafter, we select
every kth subject on the list.
Example: Select every 5
th
person on a list of the population.
Experimental Design:
A well-designed experiment includes design features that allow researchers to eliminate extraneous variables as an explanation
for the observed relationship between the independent variable(s) and the dependent variable.
Experimental Unit or Subject: The individuals on which the experiment is done. If they are people then we call them subjects
Factor: The explanatory variables in the study
Level: The degree or value of each factor.
Treatment: The condition applied to the subjects. When there is one factor, the treatments and the levels are the same.
Control. Control refers to steps taken to reduce the effects of other variables (i.e., variables other than the independent variable
and the dependent variable). These variables are called lurking variables.
Control involves making the experiment as similar as possible for subjects in each treatment condition. Three control strategies
are control groups, placebos, and blinding.
Control group. A control group is a group that receives no treatment
Placebo. A fake or dummy treatment.
Blinding: Not telling subjects whether they receive the placebo or the treatment
Double blinding: neither the researchers or the subjects know who gets the treatment or placebo
Randomization. Randomization refers to the practice of using chance methods (random number tables, flipping a coin, etc.) to
assign subjects to treatments.
Replication. Replication refers to the practice of assigning each treatment to many experimental subjects.
Bias: when a method systematically favors one outcome over another.
Types of design:
Completely randomized design With this design, subjects are randomly assigned to treatments.
Randomized block design, the experimenter divides subjects into subgroups called blocks. Then, subjects within each block
are randomly assigned to treatment conditions. Because this design reduces variability and potential confounding, it produces a
better estimate of treatment effects.
Matched pairs design is a special case of the randomized block design. It is used when the experiment has only two treatment
conditions; and subjects can be grouped into pairs, based on some blocking variable. Then, within each pair, subjects are
randomly assigned to different treatments.
Part II in Pictures: Sampling Methods
Simple Random Sample: Every group of n objects has an equal chance of being selected.
Stratified Random Sampling: Cluster Sampling:
Break population into strata (groups) Randomly select clusters then take all
then take an SRS of each group. Members in the cluster as the sample.
Systematic Random Sampling:
Select a sample using a system, like selecting every
third subject.
Experimental Design:
Completely Randomized Design: Randomized Block Design:
Matched Pairs Design:
/ 14
End of Document
317

FAQs

What is the formula for the Interquartile Range (IQR)?
The Interquartile Range (IQR) is calculated using the formula IQR = Q3 – Q1. This measure helps to identify the spread of the middle 50% of the data points in a dataset, providing insights into its variability.
How do you test for outliers in a dataset?
To test for outliers, you can use the formula 1.5(IQR) above Q3 or below Q1. If a data point falls outside this range, it is considered an outlier. This method is commonly used in statistical analysis to ensure the integrity of the data.
What does the 68-95-99.7 rule indicate in statistics?
The 68-95-99.7 rule, also known as the empirical rule, states that for a normal distribution, approximately 68% of the data falls within one standard deviation of the mean, about 95% falls within two standard deviations, and around 99.7% falls within three standard deviations. This rule is essential for understanding the distribution of data in statistics.
What is the difference between stratified sampling and cluster sampling?
Stratified sampling involves dividing the population into groups, or strata, based on certain characteristics, and then taking a simple random sample from each group. In contrast, cluster sampling assigns every member of the population to one group, or cluster, and then randomly selects entire clusters for sampling. This distinction is crucial for designing effective surveys.
What is the significance of the correlation coefficient (r)?
The correlation coefficient (r) measures the strength of the linear relationship between two variables. Values close to 1 or -1 indicate a strong linear relationship, while values near 0 suggest a weak relationship. Understanding this coefficient is vital for interpreting data relationships in statistics.
What is the purpose of randomization in experimental design?
Randomization is used in experimental design to assign subjects to treatments using chance methods. This practice helps eliminate bias and ensures that the treatment groups are comparable, which is essential for the validity of the experiment's results.
How is a residual calculated in regression analysis?
In regression analysis, a residual is calculated as the difference between the observed value and the predicted value. It is expressed as residual = observed - predicted. Analyzing residuals helps assess the fit of the regression model and identify any patterns that may indicate issues with the model.