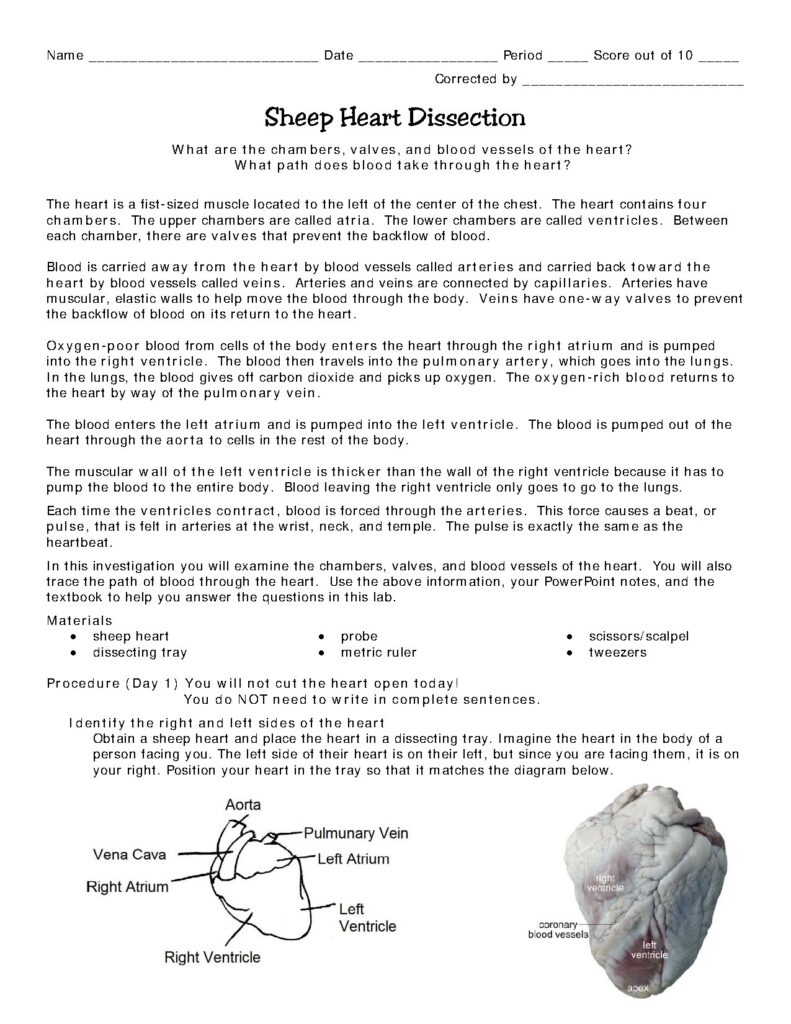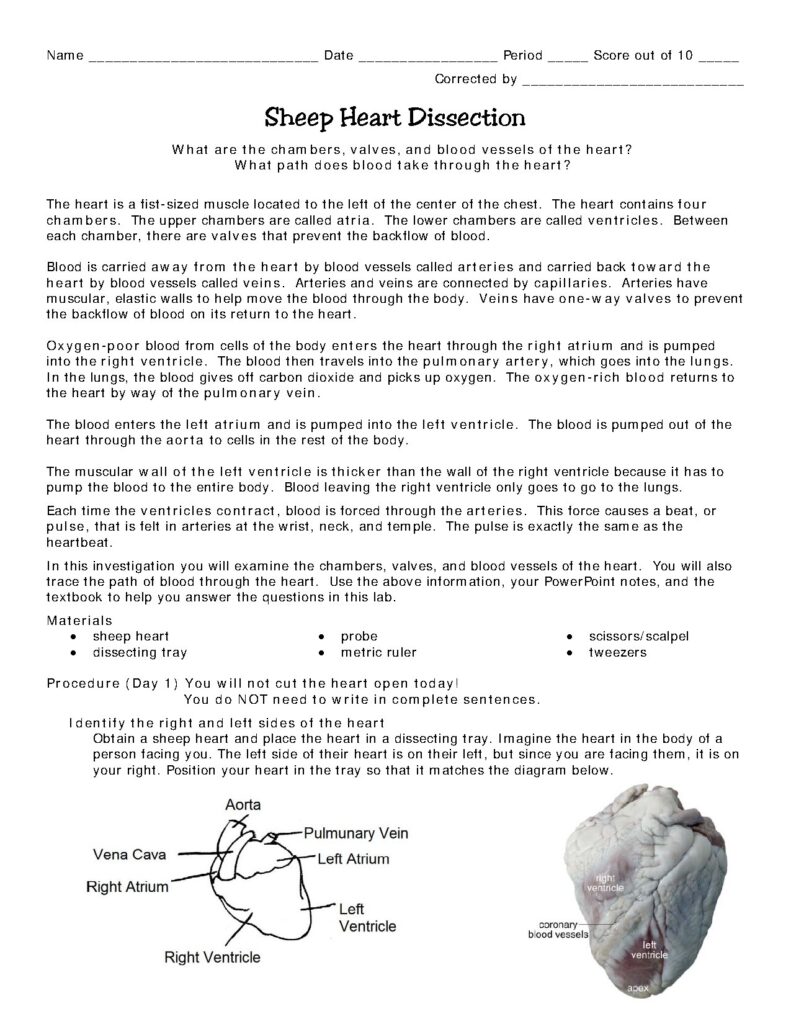


Access an extensive, community-driven archive of cardiovascular system PDFs, cardiac cycle worksheets, hemodynamic flow diagrams, and clinical exam study guides curated to maximize your medical grades and physiological understanding. This dedicated resource library tracks the complex, pressurized architecture of the human circulatory apparatus—ranging from the microscopic mechanics of coronary perfusion and electrical conduction pathways to the systemic regulation of blood pressure and cardiac output. Whether you are troubleshooting the stages of the Wiggers diagram, mapping the pressure gradients of the systemic circuit, or preparing for an advanced university physiology or cardiology test bank, these files give you instant, downloadable clarity.
The Cardiovascular System (or Circulatory System) is the integrated, pressurized organ network responsible for the rapid transport of oxygen, nutrients, hormones, and metabolic waste products throughout the human body. Far from a simple passive pump, the system functions as a highly regulated, closed-loop hydraulic circuit composed of the heart (the mechanical pump), the vascular network (the distribution conduit), and blood (the transport medium). Students investigate the system through the lenses of Cardiac Physiology (myocardial contraction, valve dynamics, and electrical conduction), Vascular Hemodynamics (flow, pressure, and resistance), and Systemic Integration (the neuro-hormonal control of blood pressure). The field demands extreme precision in interpreting pressure-volume loops, identifying ECG waveforms, and calculating systemic vascular resistance ($SVR$). Studying the cardiovascular system builds advanced competencies in fluid dynamics modeling, clinical diagnostic deduction, and multi-system pathology integration—skills foundational to every medical, surgical, and cardiovascular research career.
Our collaborative document network hosts student-shared lab reports, hemodynamic pathway maps, and comprehensive midterm review packages organized across the fundamental branches of cardiovascular scholarship:
The Cardiac Cycle: Download high-yield cardiac cycle diagrams and Wiggers diagrams mapping out the temporal synchronization of atrial/ventricular contraction and valve states.
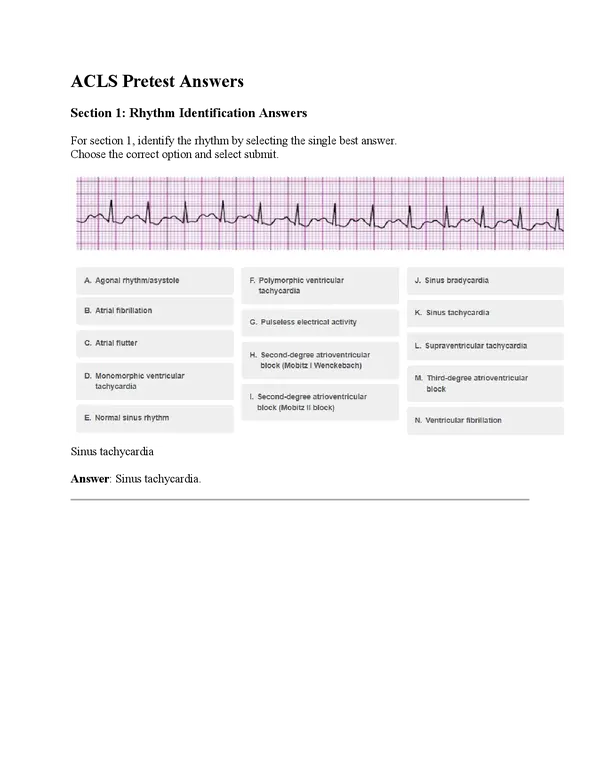
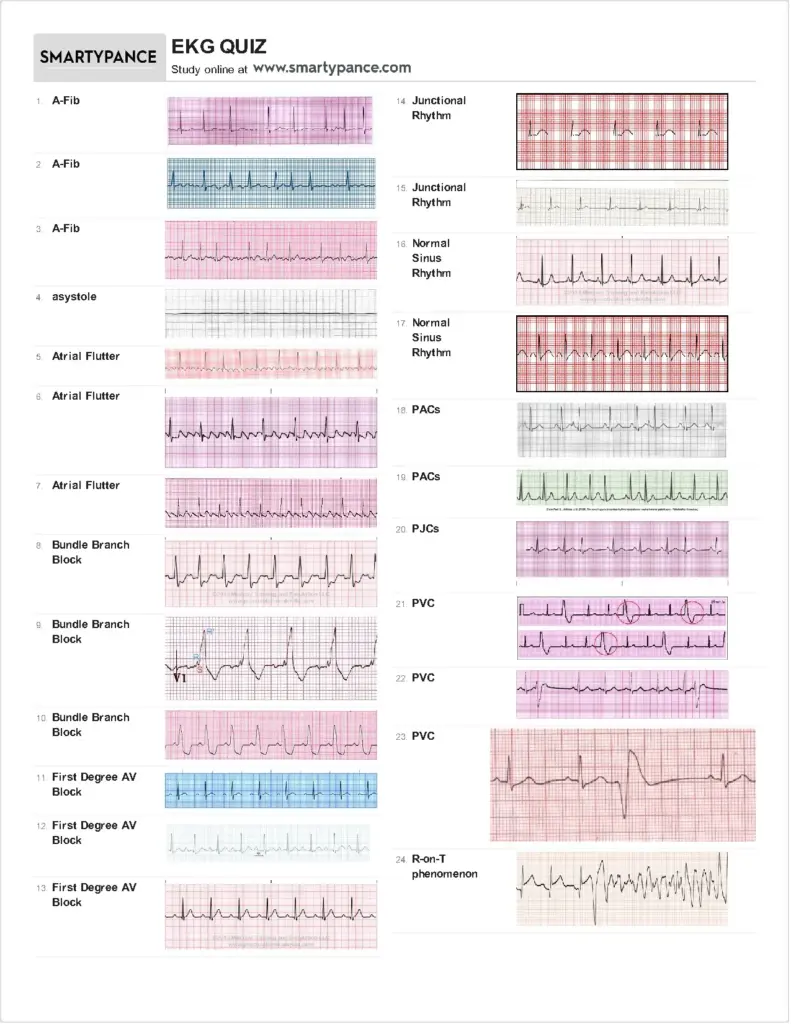
Conduction Pathways: Access specialized ECG interpretation guides detailing the depolarization/repolarization intervals ($P$–$QRS$–$T$) and the identification of primary cardiac arrhythmias.
Pressure-Flow Relationships: Download functional vascular resistance worksheets using Poiseuille’s Law to calculate blood flow velocity and systemic vascular resistance ($SVR$).
Control Mechanisms: Access comprehensive blood pressure regulation charts tracing the baroreceptor reflex, the Renin-Angiotensin-Aldosterone System ($RAAS$), and sympathetic/parasympathetic modulation.
Circulatory Integration: Download comparative systemic vs. pulmonary circuit breakdown sheets highlighting the structural differences in pressure, oxygenation, and vessel wall thickness between the two loops.
Microcirculation: Review study sets detailing capillary exchange dynamics, Starling’s forces (hydrostatic vs. oncotic pressure), and interstitial fluid balance.
When analyzing the performance of the cardiovascular pump, physiologists rely on standardized kinetic equations to quantify health status. The reference matrix below defines the core variables essential for clinical hemodynamic assessment:
| Hemodynamic Variable | Clinical Definition | Operational Calculation Formula |
| Cardiac Output ($CO$) | Total volume of blood ejected by the heart per minute | $Heart \ Rate \ (HR) \times Stroke \ Volume \ (SV)$ |
| Stroke Volume ($SV$) | Volume of blood pumped from the left ventricle per beat | $End \ Diastolic \ Volume \ – \ End \ Systolic \ Volume$ |
| Mean Arterial Pressure ($MAP$) | The average pressure driving blood into the organs | $Diastolic \ BP + \frac{1}{3} \ (Systolic \ BP – Diastolic \ BP)$ |
| Systemic Vascular Resistance ($SVR$) | The force opposing blood flow through the systemic circuit | $\frac{MAP – Central \ Venous \ Pressure}{Cardiac \ Output} \times 80$ |
This section addresses the most frequently searched cardiovascular friction points, keyword-targeted hemodynamic prompts, and foundational questions sourced from university medical test banks.
These are the two primary structural loads acting on the heart muscle. Preload is the mechanical “stretch” placed on the ventricles at the end of diastole (the End Diastolic Volume). It is determined by the venous return—the more blood that enters the heart, the more the muscle fibers are stretched, which increases the force of the next contraction (a phenomenon known as the Frank-Starling Law). Afterload, conversely, is the total resistance the heart must pump against to eject blood into the arterial system. High systemic blood pressure or stenotic aortic valves significantly increase afterload, forcing the heart to work harder to maintain stroke volume.
The $RAAS$ is the body’s long-term systemic pressure regulation architecture. When the kidneys detect low blood pressure or low sodium, they secrete Renin, which initiates a cascade converting Angiotensinogen to Angiotensin I, and then to Angiotensin II via the ACE enzyme. Angiotensin II performs three critical tasks: it causes systemic vasoconstriction (instantly increasing $SVR$ and blood pressure), stimulates the adrenal cortex to release Aldosterone (which tells the kidneys to retain salt and water, increasing total blood volume), and triggers thirst centers in the brain.
Unlike skeletal muscle, cardiac myocytes exhibit a prolonged plateau phase during their action potential (Phase 2). This phase is characterized by an influx of calcium ions ($Ca^{2+}$) entering the cell while potassium ions ($K^+$) exit. This specific ion balance creates an extended period of electrical depolarization that prevents the heart from entering a state of tetany (a continuous, locked contraction). This plateau ensures the heart maintains a long refractory period, allowing the ventricles to fully fill with blood before the next rhythmic beat can occur.
Capillary exchange is a tug-of-war between two opposing pressures. Hydrostatic Pressure is the force exerted by blood against the capillary wall, which tends to push fluid out of the vessel into the interstitial space. Oncotic (Osmotic) Pressure is the force exerted by plasma proteins (like albumin) that are trapped inside the vessel, which tends to pull water into the vessel. Under normal physiological conditions, hydrostatic pressure dominates at the arterial end (filtration), and oncotic pressure dominates at the venous end (reabsorption), maintaining essential fluid balance.
Yes. Calculating cardiac output variables, mapping out the electrical conduction cascade, and debugging complex vascular resistance problems are daily requirements for physiology and medical students. Our global user network frequently uploads complete hemodynamics lecture summaries, downloadable cardiac cycle diagrams, and practice exam answers to help you streamline your study workflow before assessment deadlines.
Every hemodynamic matrix, conduction pathway map, and clinical flow guide across our database is maintained by a global network of students, researchers, and medical trainees who believe in open, decentralized educational tools. To see how these physiological systems connect with broader anatomical, pathological, or pharmacology fields, return to our primary Chesser Resources Browse Directory.
Ready to download premium cardiovascular system study guides or ECG interpretation guides? Join our shared academic network: navigate to your user dashboard, upload 5 of your own physiology lab reports, hemodynamics worksheets, or clinical rotation logs, and instantly secure unrestricted access to the high-yield PDFs you need to maximize your medical grades today.