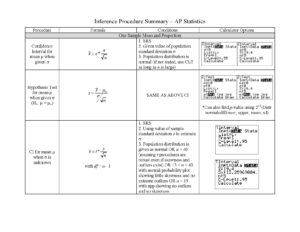
ECO254 Exam Summary provides a comprehensive overview of statistics relevant to economics. It covers key concepts such as probability distributions, statistical tests, and regression analysis. This summary is designed for students preparing for economics exams, offering insights into various statistical methods and their applications in economic contexts. Topics include discrete and continuous distributions, hypothesis testing, and interval estimation, making it a valuable resource for understanding essential statistical principles.

Key Points

  • Explains cumulative distribution functions and their significance in statistics.
  • Covers both discrete and continuous probability distributions, including examples.
  • Details various statistical tests, including t-tests and chi-square tests.
  • Includes practical applications of regression analysis in economic contexts.
Laura Okoli
34 pages
Language:English
Type:Notes
Laura Okoli
34 pages
Language:English
Type:Notes
185
/ 34
1
ECO254: STATISTIC FOR ECONOMIST I
______ is the integral of the probability density function provided that this function exists.
cumulative distribution function
A discrete probability distribution is defined as a probability distribution characterized by a probability mass
function.
The set of possible values is a topologically discrete set in the sense that all its points are isolated points
A continuous probability distribution is a probability distribution that has a probability density function.
Lebesgue measure is the standard way of assigning a measure to a subsets of an n-dimensional volume
Intuitively, a continuous random variable is the one which can take a continuous range of values as opposed to a
discrete distribution, where the set of opposite values for the random variable is at most countable.
A continuous random variable is a random variable where the data can take infinitely many values.
A non-discrete random variable m is said to be absolutely continuous, and it can also be called simply continuous
The Cauchy distribution, named after Augustin Cauchy, is a continuous probability distribution. It is also known,
especially among physicists, as the Lorentz distribution
The Cauchy distribution is often used in statistics as the canonical example of a "pathological" distribution since
both its mean and its variance are undefined.
The gamma distribution is a two-parameter family of continuous probability distributions.
The beta distribution is a family of continuous probability distributions defined on the interval [0, 1] parametrized
by two positive shape parameters, denoted by α and β, that appear as exponents of the random variable and
control the shape of the distribution.
The usual formulation of the beta distribution is also known as the beta distribution of the first kind, whereas beta
distribution of the second kind is an alternative name for the beta prime distribution.
A statistical test in which the critical area of a distribution is one-sided so that it is either greater than or less than a
certain value, but not both is called
One-tailed test
A statistical test in which the critical area of a distribution is two sided and tests whether a sample is either greater
than or less than a certain range of values is called
Two-tailed test
is a process involves estimating an interval which is known as confidence interval, within which the population
mean is likely to fall.
2
Interval Estimation
In a statistics examination for secondary students, the 22 females used in the study has a mean score of 81 and a
variance of 12 while the 20 males used has a mean score of 78 and a variance of 10. Do you think gender have an
effect on the score of these secondary students at = 0.05and = 0.01?
40
Using brandP petrol for the mean number of kilometres covered by 22 similar kekemarwa were 52.5𝑘𝑘𝑘𝑘 with
standard deviation of 7.0. Using brand Q petrol, the mean was 51km with standard deviation of 7.5. Using
significance level of 0.05, is there any reason to belief that brand P is better than brand Q?
42
Sampling where each member of the population may be chosen more than once is called
sampling with replacement
sampling where each member cannot be chosen more than once is called sampling without replacement.
The values of a population parameter and that of the corresponding statistic are not always the same. If a difference
occurs this difference is known as a
sampling error
sampling error (E) is defined as the difference between the sample statistic (s) and the population parameter being
estimated (P)
A sampling distribution is the set of all possible values of a particular statistic and you should note that there is
sampling distribution of means, sampling distribution of variance, etc.
A graph for frequency distribution can be supplied by a histogram or by a polygon graph often called a
frequency polygon
A t-test is any statistical test in which the test statistic follows a student’s t distribution if the null hypothesis is
supported
T-test is used to compare two different set of values. It is generally performed on a small set of data
The T statistic was introduced in 1908 by William Sealy Gosse
Two-sample t-tests for a difference in mean involve independent samples and overlapping samples.
The paired t-tests are of form of blocking and have greater power than unpaired tests when the paired units are
similar with respect to noise factors that are independent of membership in the two groups being compared.
The independent samples t-test is used when two separates sets of independent and identically distributed
samples are obtained, one from each of the two populations being compared.
Paired samples t-tests consist of a simple of matched pairs of similar units, or one group of units that has been
tested twice which sometimes we call repeated measures t-test
is a statistical test that is applied to categorical data to investigate how likely it is that any observed difference
between the sets arose by chance and it is good for unpaired data that can be seen from large samples.
Pearson’s Chi-Square Test
is used to assess the two types “test of goodness of fit” and tests of independence
Pearson’s Chi-Square Test
3
Yate’s correction for continuity is also called
Yate’s chi-squared test
is used when testing for independence in a contingency table.
Yate’s chi-squared test
are collections of test statistics that is used for the analysis of stratified categorical data
Cochram Mantel Statistics
shows the comparison of two groups on a different categorical response and it is used when the effect of the
explanatory variable on the response variable is influenced by covariates that can be controlled
Cochram Mantel Statistics
is a statistical test that is used on paired nominal data. It makes use of 2x2 contingency tables to determine
whether the row and column marginal frequencies are equal and its application is in the area of test in genetics
where the transmission disequilibrium test for detecting linkage dis-equilibrium.
Mc Nemar’s Test
is an approach use in ANOVA (that is a region analysis involving two qualitative factors) to detect whether the
factor variables are additively related to the expected value of the response variables.
Turkey’s Test of Additivity
The chi-square goodness of fit test is appropriate when the following conditions are met
The sampling method is simple random sampling.
The variable under study is categorical.
The expected value of the number of sample observations in each level of the variable is at least 5.
The term regression was introduced by
Francis Galton
Regression analysis is widely used for prediction and forecasting, where its use has substantial overlap with the
field of machine learning.
Regression analysis is also used to know, which of the independent variables are closely related to the dependent
variable and to establish the form of these relationship whether positive relationship or negative relationship.
Regression analysis is also used in casual relationship between a linear model that is between the dependent
variable to an independent variables, but it should be noted that correlation does not imply causation like linear
regression analysis
Given the following simple regression model Y = ao + a1X1 + a2X2, the dependent varaible in the model is
Y
Given the following simple regression model Y = ao + a1X1, the independent
varaible in the model is
X1
Application of Simple Linear regression analysis is the way by which we subject different data to statistical analysis by
using computer software such strata, e-view to analyse and predict therelationship between the dependent variable
and
independent variable
In the case of more than one explanatory variable is called regression.
Multiple
In the case of one explanatory variable is called linear regression
/ 34
End of Document
185

FAQs

What is the cumulative distribution function in statistics?
The cumulative distribution function (CDF) is the integral of the probability density function, provided that this function exists. It represents the probability that a random variable takes on a value less than or equal to a specific value. The CDF is essential in understanding the distribution of probabilities over a range of values.
What are the differences between one-tailed and two-tailed tests?
A one-tailed test is a statistical test in which the critical area of a distribution is one-sided, testing whether a sample is either greater than or less than a certain value, but not both. In contrast, a two-tailed test has a critical area that is two-sided, testing whether a sample is either greater than or less than a certain range of values. These distinctions are crucial for hypothesis testing and determining the directionality of the test.
What is the significance of the t-test in statistics?
The t-test is a statistical test used to compare two different sets of values and is generally performed on a small set of data. It follows a Student’s t distribution if the null hypothesis is supported. The t-test can be applied to independent samples or paired samples, making it versatile for various statistical analyses.
How is the chi-square test used in statistics?
The chi-square test is applied to categorical data to investigate how likely it is that any observed difference between the sets arose by chance. It is particularly useful for unpaired data and can assess both the goodness of fit and independence of two categorical variables. The test requires that the expected frequency counts in each category be sufficient for reliable results.
What is the purpose of regression analysis in statistics?
Regression analysis is a statistical process used to estimate the relationships among variables. It helps in understanding how the typical value of a dependent variable changes when any one of the independent variables is varied while the others are held constant. This analysis is widely used for prediction and forecasting, providing insights into causal relationships.
What is the role of sampling error in statistics?
Sampling error is defined as the difference between the sample statistic and the population parameter being estimated. It occurs when the sample does not perfectly represent the population, leading to discrepancies in statistical inference. Understanding sampling error is crucial for evaluating the accuracy and reliability of statistical estimates.
What does the term 'absolute continuity' refer to in probability?
In probability, a non-discrete random variable is said to be absolutely continuous if it can take on an infinite number of values within a given range. This concept is important in distinguishing between different types of probability distributions, particularly when discussing continuous random variables and their associated probability density functions.